Google Patent Data Analytics: March 2014

Thursday 13 March 2014

Visualization example: Chattanooga patentees

Assignees & Attorneys Visualization
Suppose you’re located in Chattanooga, Tennessee and want a quick snapshot of local interest in US patent protection. Begin by clicking the "Assignees & Attorneys" tab along the top of this page to load the visualization shown here.  Click the image to enlarge it, if desired (use the escape key to return).


Reconfigured Visualization restricted to TN assignees' patents
Note the US Assignees table in the lower right corner of the visualization. Drag that table’s vertical scroll bar and click on TN (i.e. Tennessee) as shown here. The number 633 beside the TN state abbreviation tells us that the underlying database (which I constructed from the USPTO’s bibliographic data for US patents which issued in 2012) contains details of 633 US patents which issued in 2012 to assignees located in Tennessee.

Notice that all of the visualization’s tables were quickly reconfigured when you clicked on TN. The original "Assignees & Attorneys Visualization" provides details of 266,864 US patents which issued in 2012. The reconfigured visualization is restricted to the 633 US patents which issued in 2012 to assignees located in Tennessee.


Vanderbilt University popup
The upper table in the reconfigured visualization shows the names of the Tennessee-based assignees that own those 633 patents. Drag that table’s vertical scroll bar to see all the assignees’ names. The blue data bars adjacent each assignee’s name correspond to the number of patents owned by each assignee. Hover your mouse over any of the data bars to obtain a popup with further details, as shown here for the data bar corresponding to Vanderbilt University.  Again, click the image to enlarge it, if desired.


Lookup Vanderbilt's web site
Click the "Lookup Assignee Web Site" link in the popup to open a web browser pre-configured to run a web search using the assignee’s name, as shown here for Vanderbilt University. If desired, you can click the search result link to visit the official web site of Vanderbilt University and learn more about that institution—which is located in Nashville, Tennessee.


Pitts & Lake, PC popup
The next table in the reconfigured visualization shows the names of the IP firms which prosecuted the US patent applications from which the aforementioned 633 Tennessee-assigned patents issued. Drag that table’s vertical scroll bar to see all of those firms’ names. The green data bars adjacent each firm name correspond to the number of patents prosecuted by each firm. Hover your mouse over any of the data bars to obtain a popup with further details, as shown here for the data bar corresponding to Pitts & Lake, PC.

Lookup Pitts & Lake, PC web site

Click the "Lookup Attorney/Agent web site" link in the popup, to open a web browser pre-configured to run a web search using the IP firm’s name, as shown here for Pitts & Lake, PC. If desired, you can click the appropriate search result link to visit the web site of Pitts & Lake, PC and learn more about that firm—which is based in Knoxville, TN.


kind code explanation popup
Returning to the reconfigured visualization, the lower left Document Kind table shows the kind code breakdown of the 633 Tennessee-assigned patents. Hover your mouse over any number in the table’s right column to obtain a kind code explanation popup, as shown here.


633 Tennessee-assigned patents popup
The reconfigured visualization’s lower central Assignee Country table shows the countries in which the assignees of the 633 Tennessee-assigned patents are located. Of course, only one country appears—the US. Hover your mouse over the US data bar to obtain a popup with further details, as shown here.


expand US assignees (add cities)
Returning to the US Assignees table in the lower right corner of the visualization, hover your mouse over the State column header then click the + symbol which appears adjacent the column header, as seen here. This expands the table by adding a City column.


explore Tennessee
Drag the expanded table’s vertical scroll bar to reveal the city breakdown for Tennessee, as shown here. The numbers adjacent each city correspond to the number of US patents which issued in 2012 to assignees located in each of the indicated Tennessee cities. Notice the entries for "Chatanooga" and "Chattanooga". The first of those reflects a typographical error in the USPTO’s underlying bibliographic data—I’ve made no effort to cleanse the data.


Reconfigured Visualization restrictedto Chattanooga assignees' patents


Further drill down reconfiguration of the visualization is possible via any of the tables. For example, click on the "Chattanooga" entry in the US Assignees table. This further reconfigures the visualization, as shown here, by restricting it to the 26 US patents which issued in 2012 to assignees located in Chattanooga, Tennessee. The upper table in the reconfigured visualization shows the names of the Chattanooga-based assignees that own those 26 patents; the next table shows the names of the IP firms which prosecuted the US patent applications from which those 26 patents issued; etc.


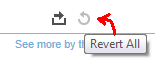
At any time, you can click the revert all button (the circular back arrow symbol) at the bottom of the visualization to return to the initial visualization and start over.

As can be seen, a good deal of data mining can be accomplished with a few mouse clicks. The foregoing example is restricted to US patents which issued in 2012 but it will be appreciated that the visualizations can be enhanced by adding more bibliographic data to the underlying database.  Visualizations based on other countries' patent bibliographic data can also be created.