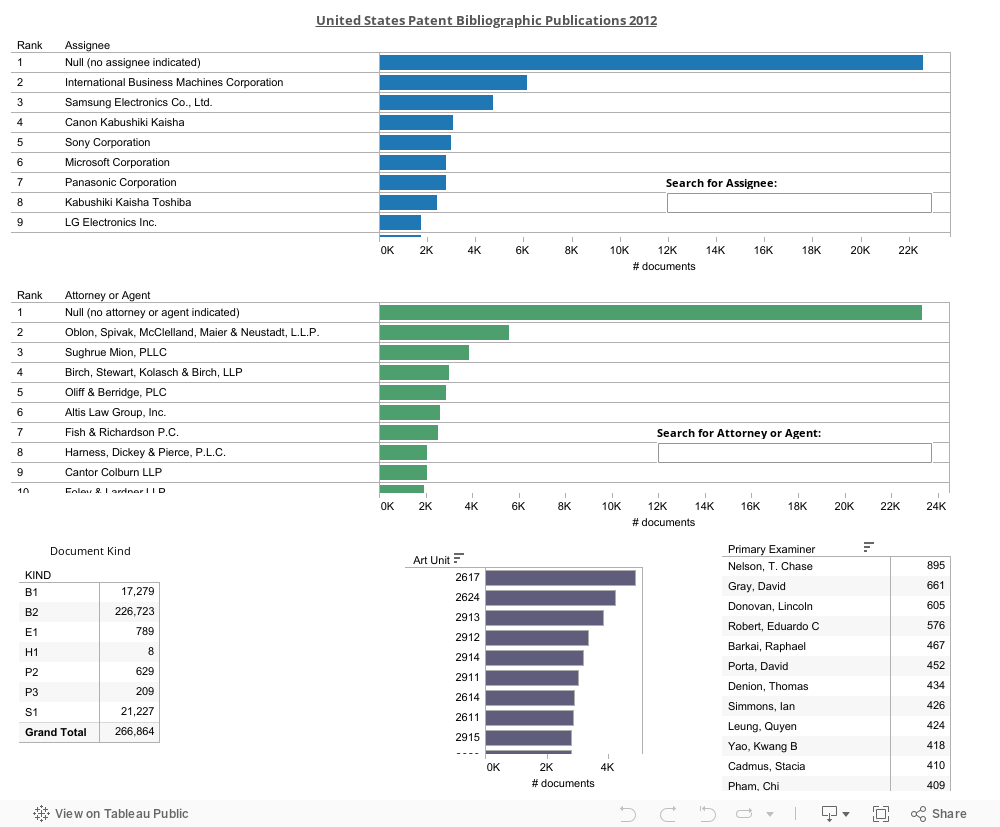
This visualization is similar to the Art Units & Examiners visualization and includes average filing-to-issue statistics (in years).
Click one of the colored data bars to restrict the visualization to patents corresponding to that data bar. Click a document total number in the Document Kind or Primary Examiner sections to restrict the visualization to patents corresponding to either of those numbers.
Hover your mouse pointer over different parts of the visualization for further details and instructions. Click the revert all button (the circular back arrow symbol) at the bottom of the visualization to return to the initial visualization. See the FAQ tab for further details.