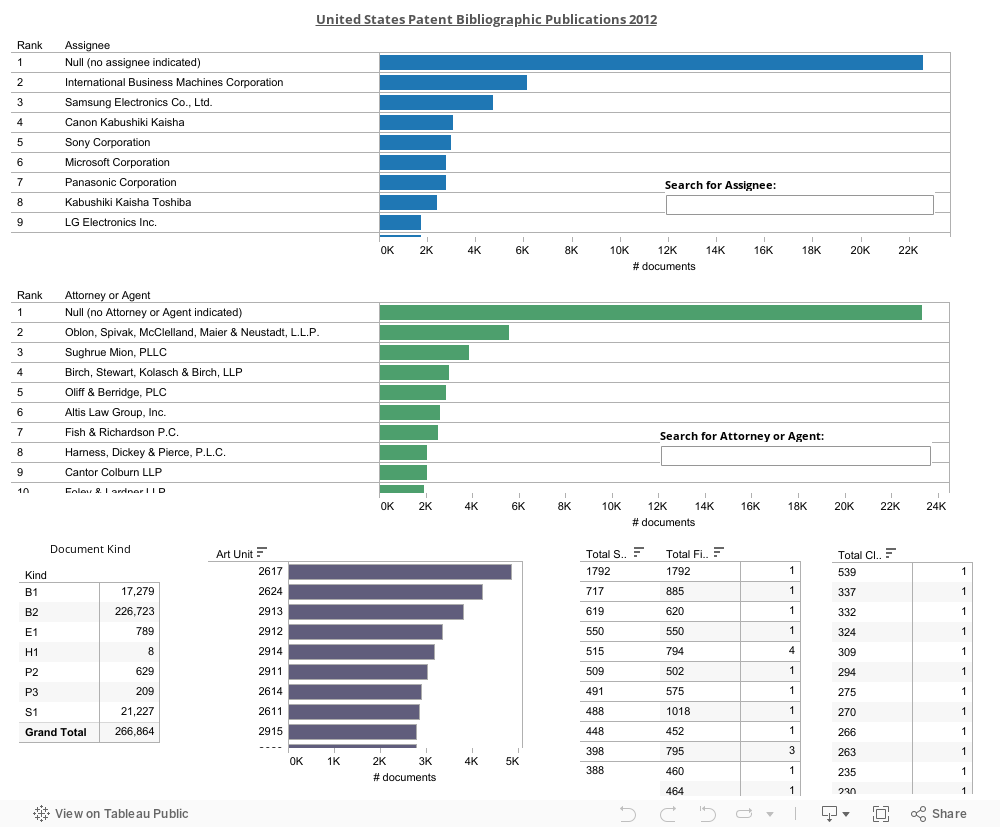
the IP law firms which prosecuted the corresponding patent applications;
the Group Art Units in which the patents are classified by the USPTO;
total number of drawing sheets per patent;
total number of drawing figure per patent; and
total number of claims per patent.
Click one of the colored data bars to restrict the visualization to patents corresponding to that data bar. Click a document total number in the Document Kind, Total Sheets/Figures or Total Claims sections to restrict the visualization to patents corresponding to any of those numbers. Hover your mouse pointer over different parts of the visualization for further details and instructions. Click the revert all button (the circular back arrow symbol) at the bottom of the visualization to return to the initial visualization. See the FAQ tab for further details.